Introduction
Scope
Traffic Weaver is a Python package developed to generate a semi-synthetic signal (time series) with finer granularity, based on averaged time series, in a manner that, upon averaging, closely matches the original signal provided. The key components utilized to recreate the signal encompass:
oversampling
recreating from average with a given strategy,
stretching to match the integral of the original time series,
interpolating,
smoothing,
repeating,
applying trend,
adding noise.
The primary motivation behind Traffic Weaver is to furnish semi-synthetic time-varying traffic in telecommunication networks, facilitating the development and validation of traffic prediction models, as well as aiding in the deployment of network optimization algorithms tailored for time-varying traffic.
The purpose of Traffic Weaver is to generate new time-varying data based on an already available sample of data, i.e., to create semi-synthetic data when the size of real data is either insufficient or the time points at which the data were measured are too rare.
In consequence, it can generate larger and diverse datasets with similar traffic patterns based on the original traffic.
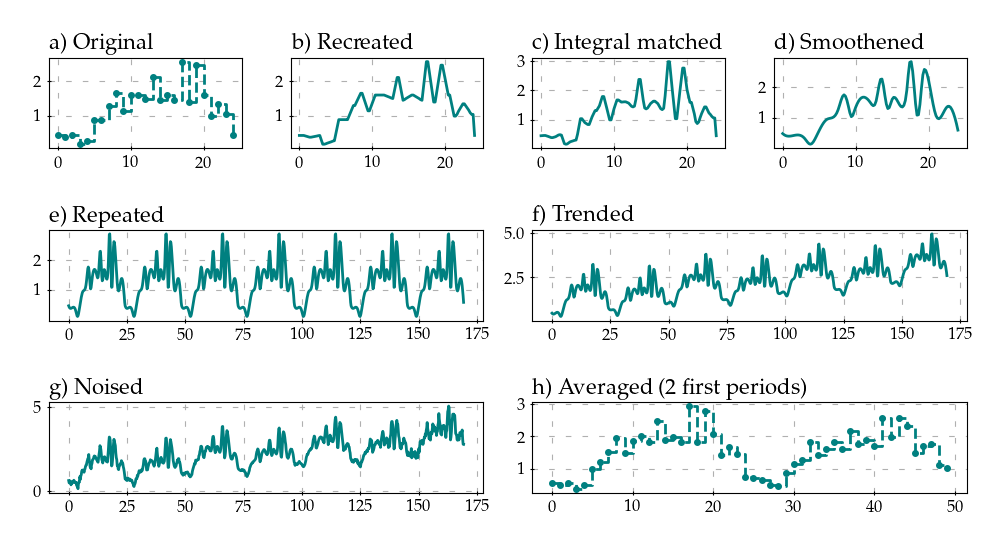
Fig. 1 shows a general usage example. Based on the provided original averaged time series (a), the signal is n-times oversampled and recreated from average values with a predefined strategy (b). Next, it is stretched to match the integral of the input time series function (c). Further, it is smoothed with a spline function (d). In order to create weekly semi-synthetic data, the signal is repeated seven times (e), applying a long-term trend consisting of sinusoidal and linear functions (f). Finally, the noise is introduced to the signal, starting from small values and increasing over time (g). To validate the correctness of the applied processing, (h) presents the averaged two periods of the created signal, showing that they closely match the original signal (except the applied trend).

Fig. 1 Regenerating time-varying traffic from the averaged traffic sample: original traffic (a); recreated from average (b); matched with the integral of the original signal (c); smoothed (d); repeated 7 times (e); trended with sinusoidal and linear function (f); noised (g); averaged (h).
Architecture
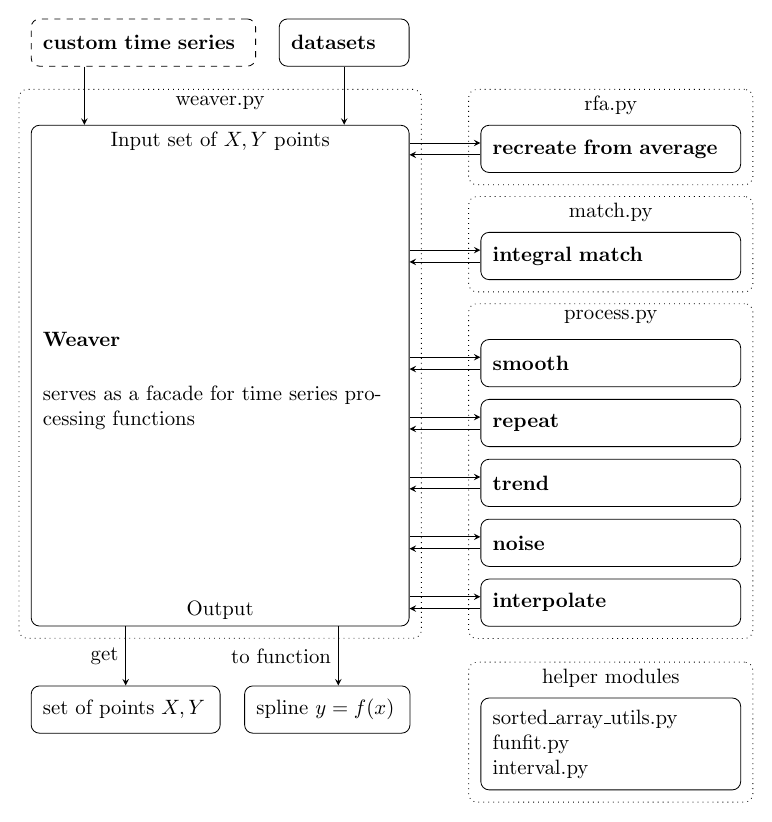
Fig. 2 presents overview of software architecture. Weaver, located in weaver.py module, wraps supplied signal (time series) data and provides an interface for processing functionalities. Time series can be either specified by the user or obtained from embedded example datasets. Individual functionalities provided by the Weaver are delegated to other modules, e.g., recreating from average functionality is located in rfa.py module. However, it is possible to use individual functionalities from they corresponding modules regardless of wrapping time series into Weaver. Weaver allows to retrieve processed data either as sampled points or continues spline function.

Fig. 2 Software architecture.
Functionalities
This section describes the main functionalities provided by the Traffic Weaver. In the below description, the term interval refers to the distance between two sampled points in the input time series. The aim of the Weaver is to create an output time series with multiple points inserted in each interval.
- Class
Weaver(x, y) Weaver is an interface for recreating and processing signal. It takes as an input time series provided as two lists containing values of independent and dependent variables. It delegates processing to other modules and allows to retrieve the recreated signal either as lists of values of independent and dependent variables or as a spline, using
get()andto_function()methods, respectively.
- Class
- Recreating from average
Recreating from average is a recreation of a signal with finer sampling granularity based on the supplied strategy. The number of created points between each interval (pair of points in the original time series) is provided as a parameter. The strategy determines how the created time series transits between points, i.e., how the new points are located. The software provides several strategies, namely,
ExpAdaptiveRFA(),ExpFixedRFA(),LinearAdaptiveRFA(),LinearFixedRFA(),PiecewiseConstantRFA(),CubicSplineRFA(). E.g., ExpAdaptiveRFA creates an adaptive transition window for each interval by combining linear and exponential functions. The size of the window is inversely proportional to the change of the function value on both edges of the interval, i.e., if the function value has a higher change on the right side than on the left side of the interval, the right side transition window is smaller than the left one.The Weaver class provides the
recreate_from_average(n, rfa_class, **kwargs):method that delegates the execution to the rfa module and takes as an input number of samples n in each interval after oversampling, recreate from average strategy rfa_class inheritingAbstractRFA()class, and a dictionary of parameters passed to the selected strategy.
- Integral matching
It aims to reshape the time series to match its integral to the integral of the reference piecewise constant function over the same domain (the original time series). It does that by stretching the signal in intervals such that the integral in the interval of the current time series is equal to the integral of the same interval in the reference function. Points in each interval are transformed inversely proportionally to the exponential value of distance from the interval center. Integral for the recreated function and for the original function can be calculated either using trapezoidal or rectangular rule.
The Weaver class provides the
integral_match(target_function_integral_method, reference_function_integral_method, **kwargs)method that delegates the execution to the match module and takes as an input a dictionary of parameters passed to the matching function. The time series currently stored in the Weaver is matched with a reference to the originally passed function to the class. target_function_integral_method and reference_function_integral_method specifies how integral is calculated for target and reference function, respectively.
- Smoothing
It smooths a function using smoothing splines.
The Weaver class provides the
smooth(s)method to delegate the execution to the smoothing function and takes s as an argument. The argument s is a smoothing condition that controls the tradeoff between closeness and smoothness of the fit. Larger s means more smoothing, while smaller values of s indicate less smoothing. If s is None, its ‘good’ value is calculated based on the number of samples and standard deviation.
- Repeating
It repeats time series a given number of times, resulting in a long term time series containing periodic, e.g., daily or weakly, patterns.
The Weaver class provides the
repeat(n)method to repeat the time series. n is an argument passed to the function, defining how many times to repeat the time series.
- Trending
It applies a trend to the time series according to the specified function. It allows adding a long-term trend to the time series, e.g., constant dependent variable increase over time.
The Weaver class provides the
trend(trend_func, normalized)method to apply a trend to the processed time series. The argument trend_function is a callable that shifts the value for the dependent variable based on the value of the independent variable. The callable takes one argument – the value of the independent variable – and has to return the shift value for the dependent variable. Argument normalized is a boolean determining if the trend function is normalized to the range of [0, 1].
- Noising
It applies a constant or changing over time Gaussian noise to the time series, expressed as signal to noise ratio.
The Weaver class provides the
noise(snr, **kwargs)method to apply noise to the signal. The argument snr defines the signal-to-noise ratio of a function either as a scalar value or as a list of changing values over time whose size matches the size of the independent variable.
- Interpolating
It applies an interpolation of time series using specified points.
The Weaver class provides the
interpolate(self, n: int = None, new_x=None, method='linear', **kwargs)method to interpolate the time series. The argument n is the Number of fixed space samples in new interpolated function. new_x is an list of points where to evaluate interpolated function. It overrides n parameter. Range should be the same as original function domain. Interpolation is done according to the method parameter. Supported strategies are ‘linear’, ‘constant’, ‘cubic’ and ‘spline’.
- Truncating
It truncates a time series to a specified range. If specified points are not present in the time series, the closest points are selected such that the specified range is included.
The Weaver class provides the
truncate(x_left, x_right, x_left_as_ratio, x_right_as_ratio)method to truncate time series. Arguments x_left and x_right are values in the independent variable array to which truncate its content from the left and right side, respectively. Arguments x_left_as_ratio and x_right_as_ratio are boolean that determine if x_left and x_right are treated as ratios of the independent variable range to truncate from the left and right, respectively.
- Normalizing
It normalizes the independent and dependent variable to the specified range.
The Weaver class provides the
normalize_x(min_val, max_val)andnormalize_y(min_val, max_val)method to normalize the independent and dependent variable, respectively. Arguments min_val and max_val are the minimum and maximum values for normalization.
- Datasets
The datasets module provides collected network traffic datasets.
Network operators often collect data about traffic generated by their customers. However, due to legal aspects, exact values are not shared with the public. However, the community can access averaged or summary data presented in a form of a plots. This module provides a set of datasets recreated from graphical plots which can be further resampled and regenerated using Traffic Weaver.
For more information about collecting datasets refer to datasets.
Motivation and significance
In telecommunication networks, such as backbone optical networks, many small end-to-end transmissions between individual users and devices combine into time-varying traffic, representing aggregated traffic over time. Thus, daily and weekly patterns can be observed in network traffic due to increased user activity in certain periods. Driven by the paradigm of self-driving and self-healing networks, traffic prediction, and anomaly detection gained significant research community attention in recent years. However, the community faces the problem of lacking real data, allowing for thorough experiments. Network operators are often constrained by legal aspects and cannot share the details of traffic generated by their customers. In turn, many researchers can have access either to small exemplary data or to averaged data without sufficient quality. To this end, the community relies on artificially generated data with various distributions and patterns based on their domain knowledge. However, predicting and detecting changes in real data can bring significantly more challenges than artificially generated ones. Additionally, extensive experiments performed on a large pool of appropriately diverse datasets are necessary for the development and thorough evaluation of the designed algorithms.
The purpose of Traffic Weaver is to generate new data based on an already available sample of data, i.e., to create semi-synthetic data when the size of real data is either insufficient or the time points at which the data were measured are too rare. In consequence, it can generate larger and diverse datasets with similar traffic patterns based on the original traffic.